
Analytics 101 for the Marketer: Classification, Demographics and Customer Behavior(s)
The goal of classification is to build rules or models and represent them in a simple readable form using past decisions. There are multiple techniques that can accomplish this task of gleaning intelligence from existing data – Neural Networks, SVMs, Decision Trees and so on. We’ll focus on Decision Trees in this article since they sit well with the Marketing use cases like predicting conversion rates, buying decisions etc. Sounds obtuse? We’ll demystify this in a moment.
Who will buy a computer??? Let’s look at a computer dealer who has data about his customers and purchases – Age group, Credit Status and Customer Status (is he a student or not). He is trying to figure out if a new set of customers will be interested in buying a computer- eventually to send them discounted offers. Given his constraints on the level of discounting he can provide, how does he make use of past data about other customers who have already bought a computer to answer this question?
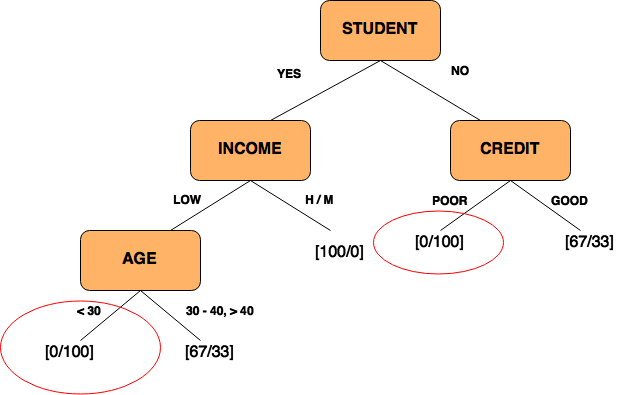
Simple: He uses a decision tree which takes in the age group, income, credit status and customer type and tries to predict an outcome based on past customer decisions around buying a computer. The goal is to get to a state where the entropy is minimum i.e. information is as unambiguous as possible like the areas marked in red on the diagram below. Some interesting observations emerge.
Example: One rule could be Students with a Low Income group at an age group < 30 never buy a computer. The 100 indicates the total number in the segment and 0 the number of people who actually bought a computer. Non –Students with Poor credit histories rarely buy a computer.
This model built on past decisions can then be extrapolated to answer a similar question about a new customer / prospect. Will the new guy be interested in buying a computer or does it make no sense sending him an offer? One caveat is that some of these insights could really be no-brainers – something that is so logical, you wouldn’t need to go through all this hassle to find out- like blind customers don’t buy TV or Turkey sales go up in Easter!!
We will get back to our behavioral story around purchase and engagement behavior aggregation using RFM scores– We scored customers on a scale of 1 to 5, derived from a clustering algorithm. One way of categorizing the clustering output could use a combination of Purchase and Engagement behavior as shown below.

Following the “Who will buy a computer” example, we can tweak the question to who will potentially become a “Highly Engaged- Valuable” Customer or how customer demographic patterns impact customer behavioral scores.
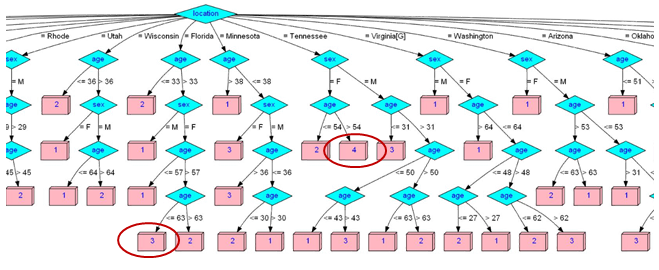
The figure above is a Classification model from a two year “simulated” data set of a grocery chain. The scores which are an aggregation of engagement & purchase behaviors are predicted based on the consumer’s location, gender and age. The decision tree spits out a set of rules that culminate in the pink boxes that denote the behavioral scores. Some rules that can be gleaned from this analysis are,
- Florida → Female → Age <= 63 → Category 3 → Highly Engaged – Loyal Purchasers.
- Tennessee → Female → Age > 54 → Category 4 → Semi-Engaged – Valuable Purchasers.
When we did the clustering using customer transactions, we got through to the first level definition of a customer i.e. Loyal – Engaged / Valuable- Semi Engaged etc. The second level of definition came in from the Decision Tree Algorithm that used demographic information and past purchase decisions i.e. aggregated behavior scores to spit out a series of rules. What we have really done is create a statistically determined segment or a customer persona. We can extend the customer persona to a much more significant level of detail for example like, “Female Middle Aged Tennessee Engaged and Highly Valuable”. If you plan on using Category RFM over normal RFM, you will be able to overlay product tendencies and develop highly targeted segments combining behavior, demographics and product / category orientation like “Young Male from New York Upstate– Electronic Geek Highly Engaged & Loyal”. Well, the value of such a segment, computed algorithmically is clearly the capability to understand and map demographic and behavioral patterns and in the second case to help understand customer product tendencies and hence identify cross sell opportunities. Well, that’s the long and short of it- the algorithms that are popular in this space are C4.5 /C5.0/ Rpart / Random Forest (Ensemble Models).